Information
- Creation
-
Creator (Definite): William Bate HardyDate: From 1989 to 1898
- Current Holder(s)
-
Description
Fig. in text:
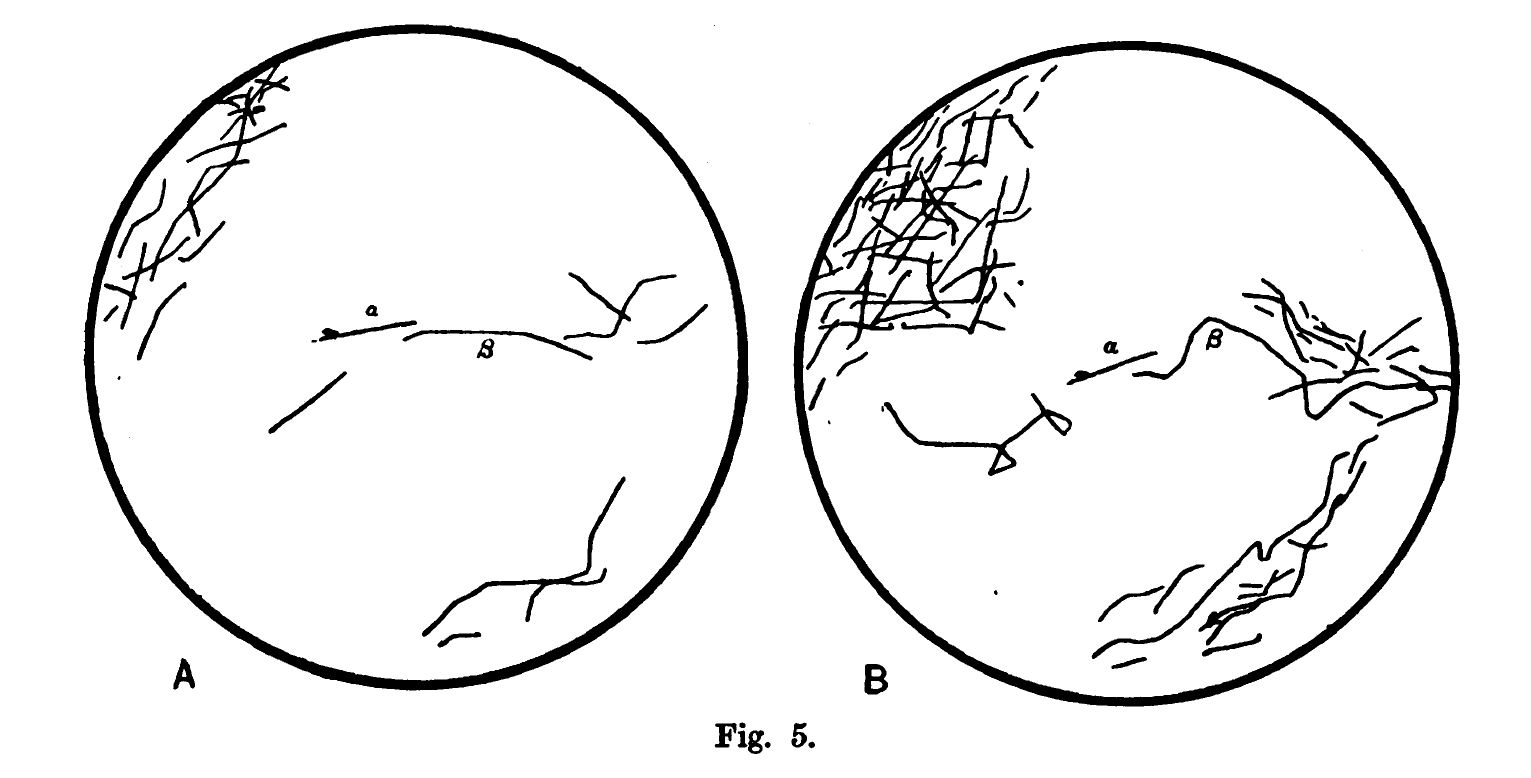
'What these various curves mean is shown by Fig. 5, which shows the appearance of the field as seen with a low power, and the aspect of the same field 16 hours later. Chain a was attacked by the only oxyphil cell in the field; it did not grow. Chain β, which was originally a continuation of chain a, grew rapidly. The first drawing represents the field, not at the commencement of the experiment, but at the close of the 6th hour of observation; the second drawing represents the appearance at the close of the 18th hour. The oxyphil cell died but remained attached to one end of chain a.' (364)
Belongs To
Links

- No links match your filters. Clear Filters
-


-
-