Information
- External URL
- Tags


Description
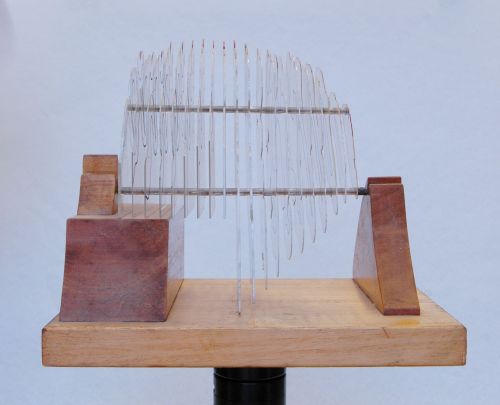
This model of the cat’s visual cortex was made by Professor David Whitteridge, in collaboration with M. Bilge, A. Bingle and K. N. Seneviratne (see Bilge et al, 1967, J. Physiol. 191, 116P). This experiment, which took place on April 23rd 1963, involved the mapping of receptive field positions during multiple penetrations through the visual areas. The model represents coronal sections at a scale of 10:1, section No. 10 lying in the horizontal plane. The spacing between sections is 1mm. Sections marked in red represent visual area I (striate cortex), yellow and white show the approximate positions of V2 and V3.


